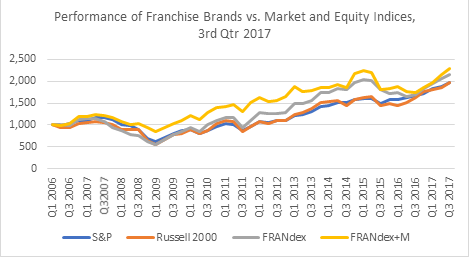
FRANdex outperformed both the S&P 500 and the Russell 2000 in Q3 2017, however its Q-o-Q growth lagged the Russell 2000 index. For the quarter, the S&P 500 was up 5.51%, and the Russell 2000 gained 6.57%. Returns for franchise companies increased by 5.53%. The non-food segment led gains with a 10.30% Q-o-Q return. Food […]

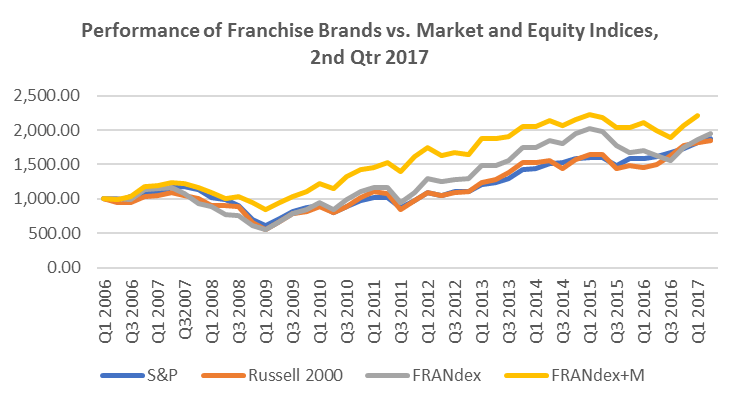
FRANdex continued to outperform both the S&P 500 and Russell 2000 in Q2 2017. For the quarter, the S&P 500 was up 2.57%, and the Russell 2000 gained 2.08%. Franchise companies increased by 6.42%. The food segment led gains with a 7.64% return and non-food brands registered a 5.64% return. Small-caps have struggled thus far […]
FRANdex tracks the performance, based on market capitalization, of 60 U.S.-based publicly-traded companies operating under and generating income through the franchise business model. Collectively, these companies operate 138 franchise brands. All index levels are normalized to 1,000 at Q1 2006 for comparison purposes, and all remaining periods are adjusted accordingly. As McDonald’s represents over 25% […]
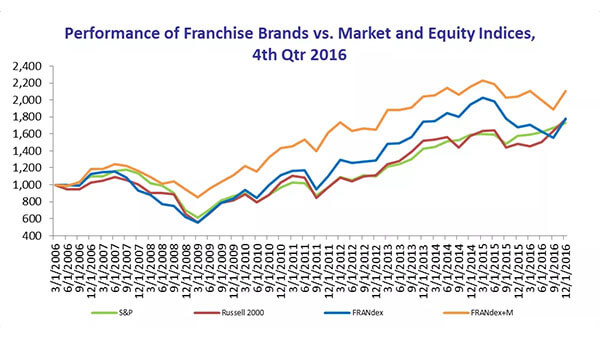
The second quarter of 2016 was marked by uncertainty, as legislative rulings challenged the structure of the business model. Planet Fitness (PLNT) registered the highest gain at 38.1%, followed by Jack in the Box (JACK). Other top performers were Papa Johns (PZZA), Krispy Kreme Doughnuts (KKD), and Wingstop (WING); immediately after this reporting period, Krispy […]